The Massachusetts Community Health Assessment
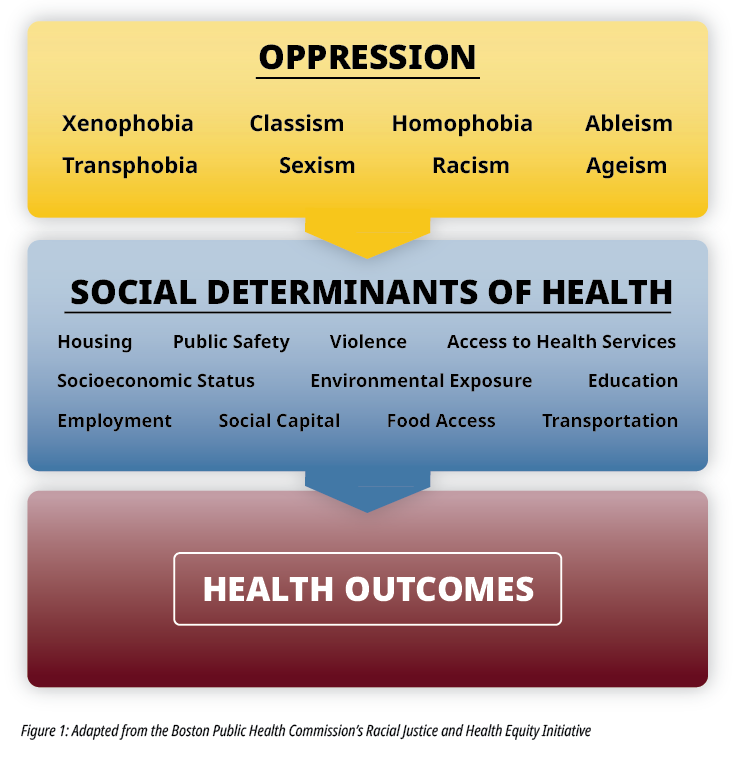
As you look at data on these reports, you may see differences among population groups. The differences are especially noticeable between white people and people of color. These differences exist because of structural racism. These differences are NOT because of an individual’s choices, behaviors, or identity. Systems of oppression, such as racism, cause harm to everyone. They also influence the social determinants of health (SDoH), which impact health outcomes.
If you decide to share these data, remember to use racial equity context and framing. The DPH Racial Equity Data Road Map is one resource that can help.
Additionally, currently, these reports have a lack of or limited data broken down by sexual orientation, gender identity, and intersex status. Many of the indicators include data by gender. However, the data made available reflects gender as sex assigned by birth (male/female). This binary framework of reporting does not capture the full spectrum of gender identify. Gender is a multi-dimensional construct that includes identity and expression. By maintaining binary language, data sources can be exclusionary and render transgender and non-binary populations invisible. By gathering information around gender identity, sex assigned at birth, and sexual orientation, DPH can provide opportunities to monitor population health and the impact of policies and other macro-level changes and interventions on population health and health inequities.